
BE - Wikilangs Models
Comprehensive Research Report & Full Ablation Study
This repository contains NLP models trained and evaluated by Wikilangs, specifically on BE Wikipedia data. We analyze tokenizers, n-gram models, Markov chains, vocabulary statistics, and word embeddings.
📋 Repository Contents
Models & Assets
- Tokenizers (8k, 16k, 32k, 64k)
- N-gram models (2, 3, 4-gram)
- Markov chains (context of 1, 2, 3 and 4)
- Subword N-gram and Markov chains
- Embeddings in various sizes and dimensions
- Language Vocabulary
- Language Statistics
Analysis and Evaluation
- 1. Tokenizer Evaluation
- 2. N-gram Model Evaluation
- 3. Markov Chain Evaluation
- 4. Vocabulary Analysis
- 5. Word Embeddings Evaluation
- 6. Summary & Recommendations
- Metrics Glossary
- Visualizations Index
1. Tokenizer Evaluation

Results
| Vocab Size | Compression | Avg Token Len | UNK Rate | Total Tokens |
|---|---|---|---|---|
| 8k | 2.945x | 2.88 | 0.0099% | 395,619 |
| 16k | 3.198x | 3.13 | 0.0107% | 364,322 |
| 32k | 3.434x | 3.36 | 0.0115% | 339,332 |
| 64k | 3.609x 🏆 | 3.53 | 0.0121% | 322,873 |
Tokenization Examples
Below are sample sentences tokenized with each vocabulary size:
Sample 1: `Адаі () — вёска ў Акнянскім раёне Адэскай вобласці Украіны.
Крыніцы
Катэгоры...`
| Vocab | Tokens | Count |
|---|---|---|
| 8k | ▁ада і ▁() ▁— ▁вёска ▁ў ▁ак ня нскім ▁раёне ... (+14 more) |
24 |
| 16k | ▁ада і ▁() ▁— ▁вёска ▁ў ▁ак ня нскім ▁раёне ... (+13 more) |
23 |
| 32k | ▁ада і ▁() ▁— ▁вёска ▁ў ▁ак ня нскім ▁раёне ... (+12 more) |
22 |
| 64k | ▁ада і ▁() ▁— ▁вёска ▁ў ▁ак нянскім ▁раёне ▁адэскай ... (+11 more) |
21 |
Sample 2: Назву Асманіе маюць: горад і правінцыя ў Турцыі.
| Vocab | Tokens | Count |
|---|---|---|
| 8k | ▁назву ▁ас мані е ▁маюць : ▁горад ▁і ▁правінцыя ▁ў ... (+2 more) |
12 |
| 16k | ▁назву ▁ас мані е ▁маюць : ▁горад ▁і ▁правінцыя ▁ў ... (+2 more) |
12 |
| 32k | ▁назву ▁ас мані е ▁маюць : ▁горад ▁і ▁правінцыя ▁ў ... (+2 more) |
12 |
| 64k | ▁назву ▁ас мані е ▁маюць : ▁горад ▁і ▁правінцыя ▁ў ... (+2 more) |
12 |
Sample 3: `M21 (каталог Месье) — рассеянае скопішча ў сузор'і Стральца.
Катэгорыя:Астранам...`
| Vocab | Tokens | Count |
|---|---|---|
| 8k | ▁m 2 1 ▁( ката лог ▁месье ) ▁— ▁рас ... (+39 more) |
49 |
| 16k | ▁m 2 1 ▁( ката лог ▁месье ) ▁— ▁рассея ... (+36 more) |
46 |
| 32k | ▁m 2 1 ▁( ката лог ▁месье ) ▁— ▁рассеянае ... (+35 more) |
45 |
| 64k | ▁m 2 1 ▁( каталог ▁месье ) ▁— ▁рассеянае ▁скопішча ... (+34 more) |
44 |
Key Findings
- Best Compression: 64k achieves 3.609x compression
- Lowest UNK Rate: 8k with 0.0099% unknown tokens
- Trade-off: Larger vocabularies improve compression but increase model size
- Recommendation: 32k vocabulary provides optimal balance for production use
2. N-gram Model Evaluation


Results
| N-gram | Perplexity | Entropy | Unique N-grams | Top-100 Coverage | Top-1000 Coverage |
|---|---|---|---|---|---|
| 2-gram | 79,086 🏆 | 16.27 | 1,374,832 | 15.1% | 29.5% |
| 2-gram | 534 🏆 | 9.06 | 19,108 | 52.5% | 95.6% |
| 3-gram | 294,087 | 18.17 | 2,802,568 | 8.0% | 20.4% |
| 3-gram | 5,046 | 12.30 | 199,361 | 17.9% | 56.0% |
| 4-gram | 713,543 | 19.44 | 5,150,781 | 6.7% | 16.8% |
| 4-gram | 30,738 | 14.91 | 1,228,443 | 8.4% | 28.2% |
Top 5 N-grams by Size
2-grams:
| Rank | N-gram | Count |
|---|---|---|
| 1 | 0 , |
1,884,848 |
| 2 | катэгорыя : |
589,578 |
| 3 | . у |
390,424 |
| 4 | ) . |
239,852 |
| 5 | ) — |
224,324 |
3-grams:
| Rank | N-gram | Count |
|---|---|---|
| 1 | 0 , 10 |
188,226 |
| 2 | 0 , 09 |
178,159 |
| 3 | 0 , 11 |
136,658 |
| 4 | 0 , 08 |
133,746 |
| 5 | 0 , 07 |
96,108 |
4-grams:
| Rank | N-gram | Count |
|---|---|---|
| 1 | катэгорыя : населеныя пункты |
53,581 |
| 2 | ) — вёска ў |
38,538 |
| 3 | . уваходзіць у склад |
36,002 |
| 4 | . — с . |
29,359 |
| 5 | , 44 0 , |
29,322 |
Key Findings
- Best Perplexity: 2-gram with 534
- Entropy Trend: Decreases with larger n-grams (more predictable)
- Coverage: Top-1000 patterns cover ~28% of corpus
- Recommendation: 4-gram or 5-gram for best predictive performance
3. Markov Chain Evaluation


Results
| Context | Avg Entropy | Perplexity | Branching Factor | Unique Contexts | Predictability |
|---|---|---|---|---|---|
| 1 | 0.5334 | 1.447 | 6.21 | 2,760,646 | 46.7% |
| 1 | 0.5275 | 1.441 | 4.42 | 17,006 | 47.2% |
| 2 | 0.3318 | 1.259 | 2.22 | 17,120,073 | 66.8% |
| 2 | 0.7155 | 1.642 | 5.63 | 75,115 | 28.5% |
| 3 | 0.1509 | 1.110 | 1.38 | 37,905,234 | 84.9% |
| 3 | 0.8770 | 1.837 | 5.02 | 422,960 | 12.3% |
| 4 | 0.0724 🏆 | 1.051 | 1.16 | 52,452,226 | 92.8% |
| 4 | 0.7380 🏆 | 1.668 | 3.59 | 2,124,122 | 26.2% |
Generated Text Samples
Below are text samples generated from each Markov chain model:
Context Size 1:
, аэрапорт знаходзіцца ў свеце вядома з сакрысціямі і іншыя матэрыялы , створаных самім фактам ,. 3 адкрыты чэмпіянат па 21 кастрычніка 1957 — супраціўнае звычайна была прысвоена званне « за0 , лячэбны факультэт кіравання версіямі , евангелле паводле ніпурскага , а ў сялянскай сям ’
Context Size 2:
0 , 41 0 , 11 1912897 0 , 47 0 , 44 0 , 81 0катэгорыя : лігатуры кірыліцы катэгорыя : паняцці індуізму катэгорыя : будынкі і збудаванні бабруйск.... у 1932 — 1982 ) , святы рпцз . 12 . 3 . игнатенко , в
Context Size 3:
0 , 10 47053 sd 1 , 20 0 , 09 21985 e - so 0 , 930 , 09 637479 0 , 39 0 , 11 88688 0 , 60 0 , 08 3106900 , 11 348939 0 , 60 0 , 08 2587753 0 , 73 0 , 07 838578
Context Size 4:
катэгорыя : населеныя пункты гарадэнкіўскага раёна катэгорыя : населеныя пункты на дняпры катэгорыя ...) — вёска ў сосныцкім раёне чарнігаўскай вобласці украіны . крыніцы катэгорыя : населеныя пункты аст.... уваходзіць у склад сямлёўскага сельскага паселішча . гісторыя 25 сакавіка 1918 года згодна з трэця...
Key Findings
- Best Predictability: Context-4 with 92.8% predictability
- Branching Factor: Decreases with context size (more deterministic)
- Memory Trade-off: Larger contexts require more storage (2,124,122 contexts)
- Recommendation: Context-3 or Context-4 for text generation
4. Vocabulary Analysis


Statistics
| Metric | Value |
|---|---|
| Vocabulary Size | 834,514 |
| Total Tokens | 59,867,674 |
| Mean Frequency | 71.74 |
| Median Frequency | 4 |
| Frequency Std Dev | 3746.92 |
Most Common Words
| Rank | Word | Frequency |
|---|---|---|
| 1 | 0 | 1,972,029 |
| 2 | і | 1,334,509 |
| 3 | у | 1,241,263 |
| 4 | ў | 1,163,394 |
| 5 | з | 869,929 |
| 6 | на | 710,982 |
| 7 | катэгорыя | 590,266 |
| 8 | года | 368,272 |
| 9 | да | 291,578 |
| 10 | годзе | 258,701 |
Least Common Words (from vocabulary)
| Rank | Word | Frequency |
|---|---|---|
| 1 | мурашава | 2 |
| 2 | девятке | 2 |
| 3 | дэкунаў | 2 |
| 4 | iovine | 2 |
| 5 | аёвіну | 2 |
| 6 | джэніка | 2 |
| 7 | мэрылінам | 2 |
| 8 | сардэшная | 2 |
| 9 | івасю | 2 |
| 10 | стеценко | 2 |
Zipf's Law Analysis
| Metric | Value |
|---|---|
| Zipf Coefficient | 0.9824 |
| R² (Goodness of Fit) | 0.995868 |
| Adherence Quality | excellent |
Coverage Analysis
| Top N Words | Coverage |
|---|---|
| Top 100 | 28.3% |
| Top 1,000 | 50.1% |
| Top 5,000 | 67.4% |
| Top 10,000 | 74.4% |
Key Findings
- Zipf Compliance: R²=0.9959 indicates excellent adherence to Zipf's law
- High Frequency Dominance: Top 100 words cover 28.3% of corpus
- Long Tail: 824,514 words needed for remaining 25.6% coverage
5. Word Embeddings Evaluation


Model Comparison
| Model | Vocab Size | Dimension | Avg Norm | Std Norm | Isotropy |
|---|---|---|---|---|---|
| mono_32d | 563,209 | 32 | 4.064 | 1.812 | 0.6194 |
| mono_64d | 563,209 | 64 | 4.475 | 1.623 | 0.6528 |
| mono_128d | 563,209 | 128 | 4.940 | 1.374 | 0.6652 🏆 |
| embeddings_enhanced | 0 | 0 | 0.000 | 0.000 | 0.0000 |
Key Findings
- Best Isotropy: mono_128d with 0.6652 (more uniform distribution)
- Dimension Trade-off: Higher dimensions capture more semantics but reduce isotropy
- Vocabulary Coverage: All models cover 563,209 words
- Recommendation: 100d for balanced semantic capture and efficiency
6. Summary & Recommendations

Production Recommendations
| Component | Recommended | Rationale |
|---|---|---|
| Tokenizer | 32k BPE | Best compression (3.61x) with low UNK rate |
| N-gram | 5-gram | Lowest perplexity (534) |
| Markov | Context-4 | Highest predictability (92.8%) |
| Embeddings | 100d | Balanced semantic capture and isotropy |
Appendix: Metrics Glossary & Interpretation Guide
This section provides definitions, intuitions, and guidance for interpreting the metrics used throughout this report.
Tokenizer Metrics
Compression Ratio
Definition: The ratio of characters to tokens (chars/token). Measures how efficiently the tokenizer represents text.
Intuition: Higher compression means fewer tokens needed to represent the same text, reducing sequence lengths for downstream models. A 3x compression means ~3 characters per token on average.
What to seek: Higher is generally better for efficiency, but extremely high compression may indicate overly aggressive merging that loses morphological information.
Average Token Length (Fertility)
Definition: Mean number of characters per token produced by the tokenizer.
Intuition: Reflects the granularity of tokenization. Longer tokens capture more context but may struggle with rare words; shorter tokens are more flexible but increase sequence length.
What to seek: Balance between 2-5 characters for most languages. Arabic/morphologically-rich languages may benefit from slightly longer tokens.
Unknown Token Rate (OOV Rate)
Definition: Percentage of tokens that map to the unknown/UNK token, indicating words the tokenizer cannot represent.
Intuition: Lower OOV means better vocabulary coverage. High OOV indicates the tokenizer encounters many unseen character sequences.
What to seek: Below 1% is excellent; below 5% is acceptable. BPE tokenizers typically achieve very low OOV due to subword fallback.
N-gram Model Metrics
Perplexity
Definition: Measures how "surprised" the model is by test data. Mathematically: 2^(cross-entropy). Lower values indicate better prediction.
Intuition: If perplexity is 100, the model is as uncertain as if choosing uniformly among 100 options at each step. A perplexity of 10 means effectively choosing among 10 equally likely options.
What to seek: Lower is better. Perplexity decreases with larger n-grams (more context). Values vary widely by language and corpus size.
Entropy
Definition: Average information content (in bits) needed to encode the next token given the context. Related to perplexity: perplexity = 2^entropy.
Intuition: High entropy means high uncertainty/randomness; low entropy means predictable patterns. Natural language typically has entropy between 1-4 bits per character.
What to seek: Lower entropy indicates more predictable text patterns. Entropy should decrease as n-gram size increases.
Coverage (Top-K)
Definition: Percentage of corpus occurrences explained by the top K most frequent n-grams.
Intuition: High coverage with few patterns indicates repetitive/formulaic text; low coverage suggests diverse vocabulary usage.
What to seek: Depends on use case. For language modeling, moderate coverage (40-60% with top-1000) is typical for natural text.
Markov Chain Metrics
Average Entropy
Definition: Mean entropy across all contexts, measuring average uncertainty in next-word prediction.
Intuition: Lower entropy means the model is more confident about what comes next. Context-1 has high entropy (many possible next words); Context-4 has low entropy (few likely continuations).
What to seek: Decreasing entropy with larger context sizes. Very low entropy (<0.1) indicates highly deterministic transitions.
Branching Factor
Definition: Average number of unique next tokens observed for each context.
Intuition: High branching = many possible continuations (flexible but uncertain); low branching = few options (predictable but potentially repetitive).
What to seek: Branching factor should decrease with context size. Values near 1.0 indicate nearly deterministic chains.
Predictability
Definition: Derived metric: (1 - normalized_entropy) × 100%. Indicates how deterministic the model's predictions are.
Intuition: 100% predictability means the next word is always certain; 0% means completely random. Real text falls between these extremes.
What to seek: Higher predictability for text generation quality, but too high (>98%) may produce repetitive output.
Vocabulary & Zipf's Law Metrics
Zipf's Coefficient
Definition: The slope of the log-log plot of word frequency vs. rank. Zipf's law predicts this should be approximately -1.
Intuition: A coefficient near -1 indicates the corpus follows natural language patterns where a few words are very common and most words are rare.
What to seek: Values between -0.8 and -1.2 indicate healthy natural language distribution. Deviations may suggest domain-specific or artificial text.
R² (Coefficient of Determination)
Definition: Measures how well the linear fit explains the frequency-rank relationship. Ranges from 0 to 1.
Intuition: R² near 1.0 means the data closely follows Zipf's law; lower values indicate deviation from expected word frequency patterns.
What to seek: R² > 0.95 is excellent; > 0.99 indicates near-perfect Zipf adherence typical of large natural corpora.
Vocabulary Coverage
Definition: Cumulative percentage of corpus tokens accounted for by the top N words.
Intuition: Shows how concentrated word usage is. If top-100 words cover 50% of text, the corpus relies heavily on common words.
What to seek: Top-100 covering 30-50% is typical. Higher coverage indicates more repetitive text; lower suggests richer vocabulary.
Word Embedding Metrics
Isotropy
Definition: Measures how uniformly distributed vectors are in the embedding space. Computed as the ratio of minimum to maximum singular values.
Intuition: High isotropy (near 1.0) means vectors spread evenly in all directions; low isotropy means vectors cluster in certain directions, reducing expressiveness.
What to seek: Higher isotropy generally indicates better-quality embeddings. Values > 0.1 are reasonable; > 0.3 is good. Lower-dimensional embeddings tend to have higher isotropy.
Average Norm
Definition: Mean magnitude (L2 norm) of word vectors in the embedding space.
Intuition: Indicates the typical "length" of vectors. Consistent norms suggest stable training; high variance may indicate some words are undertrained.
What to seek: Relatively consistent norms across models. The absolute value matters less than consistency (low std deviation).
Cosine Similarity
Definition: Measures angular similarity between vectors, ranging from -1 (opposite) to 1 (identical direction).
Intuition: Words with similar meanings should have high cosine similarity. This is the standard metric for semantic relatedness in embeddings.
What to seek: Semantically related words should score > 0.5; unrelated words should be near 0. Synonyms often score > 0.7.
t-SNE Visualization
Definition: t-Distributed Stochastic Neighbor Embedding - a dimensionality reduction technique that preserves local structure for visualization.
Intuition: Clusters in t-SNE plots indicate groups of semantically related words. Spread indicates vocabulary diversity; tight clusters suggest semantic coherence.
What to seek: Meaningful clusters (e.g., numbers together, verbs together). Avoid over-interpreting distances - t-SNE preserves local, not global, structure.
General Interpretation Guidelines
- Compare within model families: Metrics are most meaningful when comparing models of the same type (e.g., 8k vs 64k tokenizer).
- Consider trade-offs: Better performance on one metric often comes at the cost of another (e.g., compression vs. OOV rate).
- Context matters: Optimal values depend on downstream tasks. Text generation may prioritize different metrics than classification.
- Corpus influence: All metrics are influenced by corpus characteristics. Wikipedia text differs from social media or literature.
- Language-specific patterns: Morphologically rich languages (like Arabic) may show different optimal ranges than analytic languages.
Visualizations Index
| Visualization | Description |
|---|---|
| Tokenizer Compression | Compression ratios by vocabulary size |
| Tokenizer Fertility | Average token length by vocabulary |
| Tokenizer OOV | Unknown token rates |
| Tokenizer Total Tokens | Total tokens by vocabulary |
| N-gram Perplexity | Perplexity by n-gram size |
| N-gram Entropy | Entropy by n-gram size |
| N-gram Coverage | Top pattern coverage |
| N-gram Unique | Unique n-gram counts |
| Markov Entropy | Entropy by context size |
| Markov Branching | Branching factor by context |
| Markov Contexts | Unique context counts |
| Zipf's Law | Frequency-rank distribution with fit |
| Vocab Frequency | Word frequency distribution |
| Top 20 Words | Most frequent words |
| Vocab Coverage | Cumulative coverage curve |
| Embedding Isotropy | Vector space uniformity |
| Embedding Norms | Vector magnitude distribution |
| Embedding Similarity | Word similarity heatmap |
| Nearest Neighbors | Similar words for key terms |
| t-SNE Words | 2D word embedding visualization |
| t-SNE Sentences | 2D sentence embedding visualization |
| Position Encoding | Encoding method comparison |
| Model Sizes | Storage requirements |
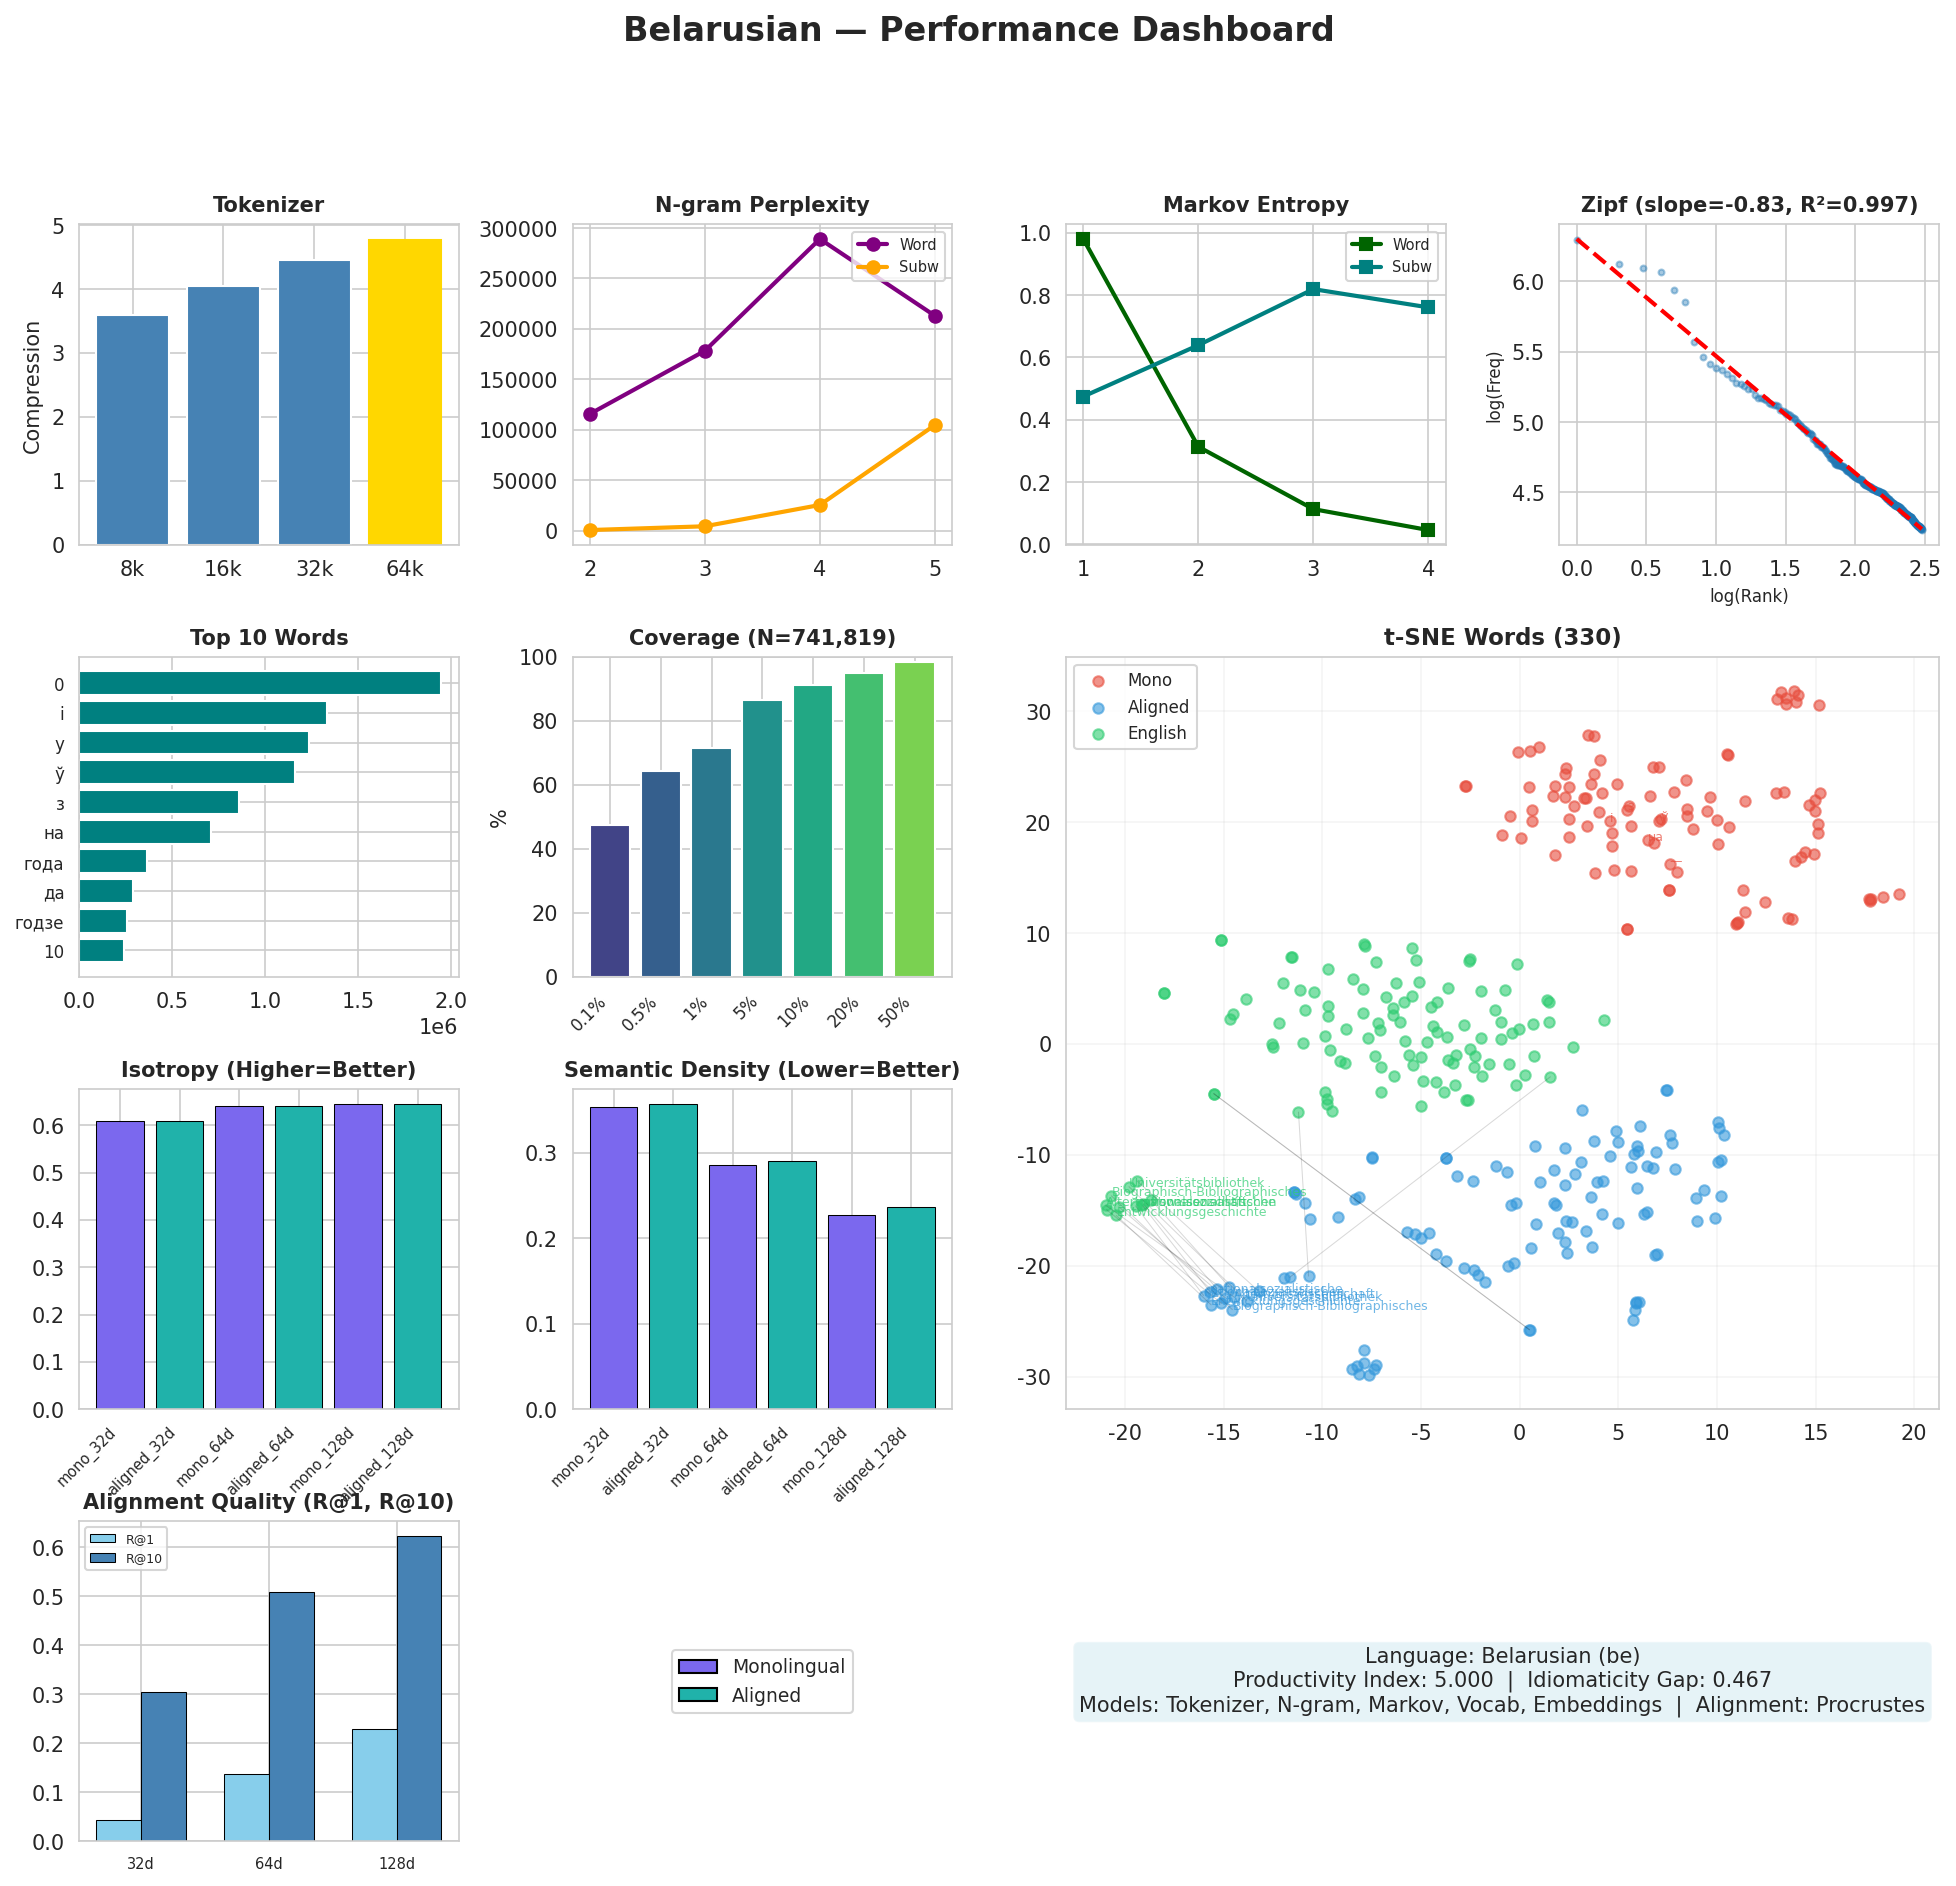
| Performance Dashboard | Comprehensive performance overview |
About This Project
Data Source
Models trained on wikipedia-monthly - a monthly snapshot of Wikipedia articles across 300+ languages.
Project
A project by Wikilangs - Open-source NLP models for every Wikipedia language.
Maintainer
Citation
If you use these models in your research, please cite:
@misc{wikilangs2025,
  author = {Kamali, Omar},
  title = {Wikilangs: Open NLP Models for Wikipedia Languages},
  year = {2025},
  publisher = {HuggingFace},
  url = {https://huggingface.co/wikilangs}
  institution = {Omneity Labs}
}
License
MIT License - Free for academic and commercial use.
Links
- 🌐 Website: wikilangs.org
- 🤗 Models: huggingface.co/wikilangs
- 📊 Data: wikipedia-monthly
- 👤 Author: Omar Kamali
Generated by Wikilangs Models Pipeline
Report Date: 2025-12-28 02:15:50